Reports
Every chart answers one specific question, and the answer is written underneath. There isn't a single chart that's there to look pretty.
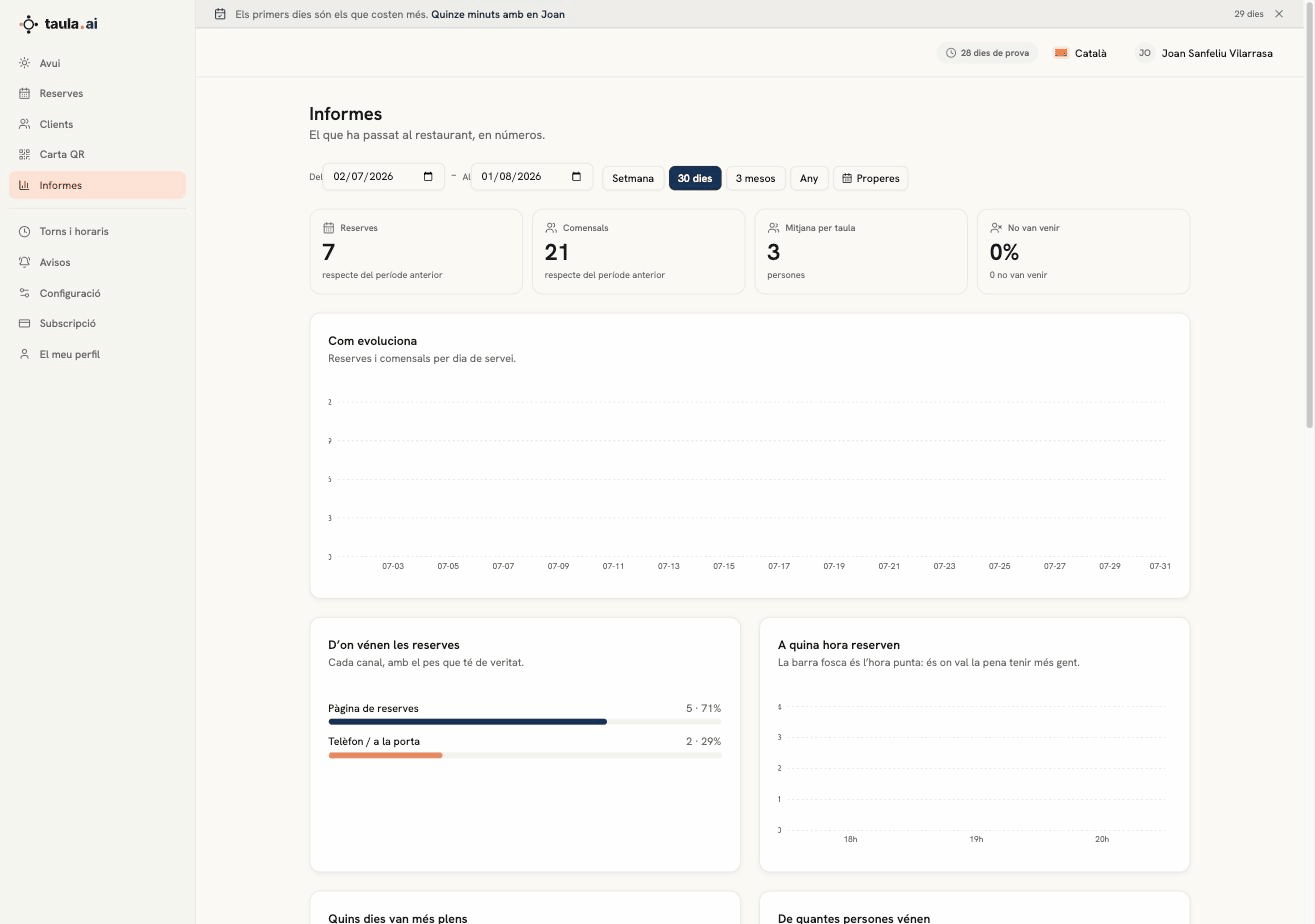
The period
At the top you pick the period: Week, 30 days, 3 months, Year, or specific dates. There's also Upcoming, which looks forward instead of back.
If everything reads zero, check the period
The default is the last 30 days. A restaurant that has just started has everything in the future, so everything reads zero and looks broken. Press Upcoming.
What each thing answers
| Question | Where to look |
|---|---|
| Am I doing better or worse than last month? | The four numbers at the top, with the change |
| Where do my bookings come from? | "Where bookings come from" |
| When is my peak? | "What time people book" — the dark bar |
| Which days could I close? | "Which days fill up" |
| Do I have too many big tables? | "Party sizes" |
| Which room fills first? | "Which rooms fill up" |
| Who are my regulars? | "Who comes back most" |
How things are counted
- A booking counts on the day they come to eat, not the day they booked.
- Cancellations, no-shows and unapproved requests don't count as service done: if they did, the numbers would be prettier and less true.
- The no-show percentage is
no-shows ÷ (services done + no-shows).